
Resource Library
Defining accuracy in ANPR systems
By XVision Engineering
- ANPR accuracy
- Evidence Frameworks
- Plate detection
- Field testing
A practical method for testing plate detection, exact reads and the evidence delivered to traffic engineers
Technical whitepaper · Version 1.1 · 7 November 2026
The denominator is part of the result.
Download the whitepaper (PDF) · 14 pages · Word document
Inside this paper
- Accuracy starts with the question
- Follow the denominator through the chain
- Define the Australian plate population
- Design an Australian capture envelope
- Freeze motion and preserve character contrast
- Match the test to the delivered evidence
- Size the sample for the acceptance decision
- Accept the configured site
- A reusable Australian field-test matrix
- Locate the failure, then test the correction
- XVision field result: Casey Complex
- Sources
This paper defines a repeatable method for evaluating automatic number plate recognition (ANPR), also called automatic licence plate recognition (ALPR) or LPR. It covers capture, detection, recognition and the delivery of usable records.
The numeric example is illustrative. The Casey Complex result is a separate field result. Source references identify the basis and context of each attributed statement.
Accuracy starts with the question
Traffic and transport engineers need to know how far they can trust plate-derived evidence before using it in a parking study, journey-time assessment or road investigation. A headline accuracy percentage leaves that question unanswered unless it states what succeeded, what was counted and where measurement ended.
Finding a plate is different from reading its complete registration. Reading an already-detected plate is different from delivering the correct registration for every eligible vehicle passage. A correct engine string lost before the agreed output is an engine success and a whole-system failure.
Measure the chain, not one favourable stage
Use one passage as the counting unit. Declare its target plate, lane, direction, capture zone and reporting boundary. Build the reference independently of the system, then report detection, exact reads, wrong reads and no-reads together. Retain the configuration and conditions beside every result.
The primary outcome is exact reads per eligible passage. Conditional measures diagnose losses. Audit false detections, duplicates and delivery problems separately.
Keep three kinds of evidence separate
| Evidence class | Role in this paper |
|---|---|
| Published engine guidance | Plate Recognizer, the engine supplier, provides capture and processing reference material [V1-V4]. Its recommendations are starting points for site testing. |
| XVision evaluation framework | The passage definitions, reference method, test matrix and acceptance process specify how to evaluate evidence. |
| Measured field result | Casey Complex is reported as plate detection for its stated deployment and period [X1]. |
Engine-vendor demonstrations do not establish XVision performance. Design targets become measured results only after a defined test. The illustrative example in Section 02 teaches the calculations; it is not a deployment result.
Scope and limits
This is a technical evaluation framework, not legal advice or a catalogue of software functions. Set thresholds from the intended engineering task, operating conditions and consequences of error. Engineers retain responsibility for interpretation and acceptance. A result applies to the population, configuration and conditions actually tested.
How XVision uses this framework
Agree the engineering question, capture envelope and test matrix. Retain evidence sources and limitations. Record the acceptance decision and follow-up checks. Confirm available records and the supported data path before agreeing the evaluation scope.
Follow the denominator through the chain
For one declared target plate per eligible passage: N is the independent passage census; D is passages with a correctly localised target plate; R is passages with an accepted text result at the chosen output; E is passages with an exact, correctly associated full-plate result. Thus E is within R, R within D and D within N.
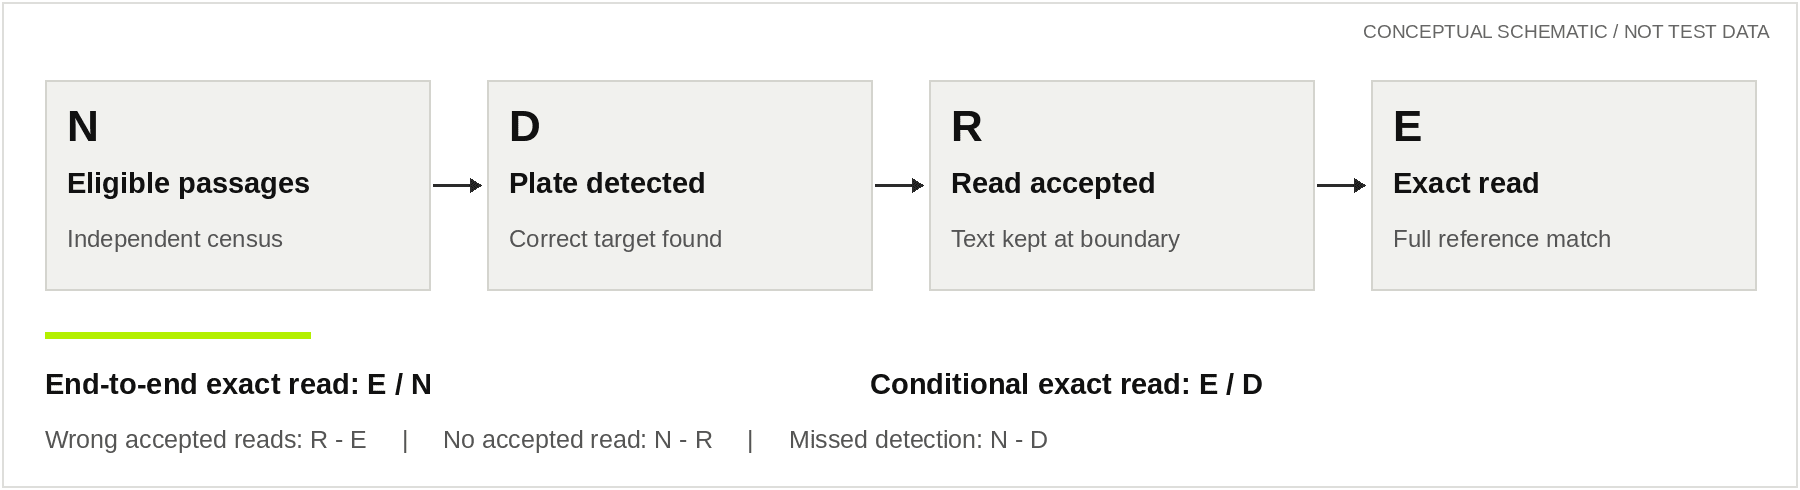
Figure 2.1. Conceptual hierarchy. Unmatched false detections and duplicate records are audited separately.
Illustrative numeric example
Assume 1,000 independent passages, each with one six-character plate and independently known truth. All results use the same configuration and output boundary: N = 1,000; D = 960; R = 940; E = 900. Of 60 no-reads, 40 are missed detections and 20 are detected plates without accepted text. The 40 wrong accepted strings each contain one character substitution. There are no insertions, other deletions, duplicates or unmatched records in this example.
| Metric | Calculation | Result |
|---|---|---|
| Detection rate | D/N = 960/1,000 | 96.0% |
| Exact reads, end-to-end | E/N = 900/1,000 | 90.0% |
| Exact reads, conditional on detection | E/D = 900/960 | 93.75% |
| Exact-read precision among accepted reads | E/R = 900/940 | 95.74% |
| Wrong reads per passage | (R - E)/N = 40/1,000 | 4.0% |
| No-reads per passage | (N - R)/N = 60/1,000 | 6.0% |
| Character accuracy, all passages: 1 - CER | 1 - (40 + 360)/6,000 | 93.33% |
| Character accuracy, accepted strings only | 1 - 40/5,640 | 99.29% |
The 360 deleted characters are the six missing characters in each no-read. Character accuracy among accepted strings looks strong while end-to-end exact reads remain 90.0%. The exact, wrong and no-read shares sum to 100%. Wrong reads among accepted strings are 40/940 = 4.26%.
The independently calculated Wilson 95% interval for 900/1,000 is 87.98%-91.71%; inputs and method appear in Section 07. For the same nested population, E/N = (D/N) × (E/D). Multiplying rates from different studies does not satisfy this identity.
Define the Australian plate population
Australian plates have state, territory and series-specific dimensions and character arrangements. A single six-character grammar or an overseas plate width cannot represent the whole operating population. Use the smallest and most demanding in-scope formats when designing capture.
| Official Australian reference | Verified detail | Evaluation consequence |
|---|---|---|
| WA state-series plates [A1] | Motor vehicle: 372 × 134 mm. Motorcycle: 254 × 100 mm full-size or 190 × 100 mm small. | Test smaller motorcycle targets separately; do not assume car-plate pixel density. |
| WA optional-plate form [A2, p.1] | Normal: 372 × 134 mm; slimline: 372 × 100 mm; half-size: 190 × 134 mm; three-quarter: 315 × 134 mm. | Width and height both vary. Measure characters as well as the plate outline. |
| WA optional formats [A2, pp.2-3] | Some custom motor-vehicle formats allow up to nine characters. Other series prescribe letter/number groups; spacing rules vary. | Preserve variable length, letter/digit positions and meaningful spaces in the reference. |
| Queensland series announcement [A3] | Six-character pattern introduced as three digits, two letters and a digit, such as 000-AA0. It also describes later position changes. | Do not enforce a three-letter/three-digit rule or merge zero with letter O. |
These are sourced examples, not a national size catalogue or proof that a format has been observed at the site. Include plates from all required jurisdictions, older series, personalised plates, slimline plates, motorcycles, trailers, heavy vehicles and auxiliary plates in the inventory. Record actual dimensions, text length, layout, colour/reflectivity and expected frequency. Select front or rear capture to suit the required vehicle classes and plate presentation.
Exact-match rules
An exact read matches every required registration character in the agreed order. One substitution, missing character or extra character fails the full-plate result. Agree case, decorative separators and space normalisation before scoring; retain both raw and normalised text. Keep letter O and digit 0 distinct. Define reading order for stacked or multi-line layouts. Count only the selected automatic result, not an alternative list containing the answer.
For trailers or vehicles presenting multiple plates, define the target and its passage association. Report jurisdiction correctness separately when the same text in different jurisdictions would identify different vehicles.
Character accuracy is a different measure
Character error rate, CER = (substitutions + deletions + insertions) / reference characters, uses a declared edit alignment. This paper labels 1 - CER as character accuracy; CER can exceed one when insertions are numerous. State the population. Missing strings contribute all their characters as deletions in an all-passage calculation. Score full plates directly rather than assuming independent character errors.
Design an Australian capture envelope
Record an operating envelope for each lane and direction: target plate formats and dimensions, capture range, near/far lane positions, approach/turning paths, measured speeds in km/h, usable observation time and day/night conditions. Define the required bounds from the actual road and task, then test their demanding combinations.
| Capture quantity | Definition at the plate | Field measurement |
|---|---|---|
| Yaw | Horizontal obliqueness between viewing direction and plate normal | Range across the zone and turning paths |
| Pitch | Vertical obliqueness between viewing direction and plate normal | Mount height, road grade and plate tilt |
| Roll | Plate-baseline rotation in the image | Device orientation, crossfall and vehicle lean |
| Pixels on plate | Projected plate width in the actual engine input | Smallest target, far lane, crop and resizing |
| Character detail | Character height, stroke width and separation in that input | Small fonts, long strings, stacked text and compression |
Figure 4.1. Capture-geometry reference table. The rotations describe different effects and are measured at the target, not only against the road centreline.
Plate Recognizer recommends roughly 100 pixels across the plate and horizontal/vertical angles no greater than 45 degrees in its setup guide [V1]. Its resolution guide describes about 100 pixels as a practical target, with 120-150 pixels adding margin in difficult scenes [V2]. These are engine-supplier recommendations, not XVision pass limits. Test combined yaw and pitch rather than treating each maximum as independent permission to use both together.
Illustrative Australian pixel calculation
For an approximately front-facing plate, estimate:
Here P is plate width in pixels, H is input image width in pixels, Wp is physical plate width and Ws is scene width at the plate plane, in matching length units [V2].
With H = 1,920 and an illustrative target P = 100, a 372 mm WA motor-vehicle plate gives Ws = 1,920 × 0.372 / 100 = 7.14 m. A 190 mm WA small motorcycle plate gives 3.65 m [A1]. The same broad view therefore provides very different pixel coverage for these two Australian targets.
This is a projection estimate for a front-facing plate, not an oblique-view guarantee. Confirm measurements in real engine-input frames. Select lens, field of view and resolution together; digital enlargement cannot restore lost detail. Set character-detail targets through reads of the smallest required characters rather than inventing a universal pixels-per-character threshold.
Freeze motion and preserve character contrast
Longer range reduces projected plate size unless optics or input resolution change. Longer focal lengths narrow the view and increase sensitivity to vibration and focus errors. Check near/far focus, mounting stability, edge detail and time in the usable zone. Plate Recognizer advises minimising range and gives 35 metres as its maximum advisable distance [V1]; use that as supplier setup guidance, not a warranted XVision range.
Shutter duration and frame rate do different jobs
A first-order diagnostic is:
Here b is motion smear in pixels, u is measured image-plane plate speed in pixels per second, and t is exposure in seconds. Measure u from actual site frames; road speed alone omits viewing geometry. Establish a blur budget with representative Australian plates at the highest in-scope speed and most demanding trajectory. Shorten exposure to meet that budget, then provide enough light and control gain to retain character contrast.
A higher frame rate gives more opportunities; it does not sharpen a blurred frame. Record the actual analysed frame rate, compression, resizing, dropped frames and processing load. Plate Recognizer distinguishes effective frame rate from capture frame rate and explains prediction-delay trade-offs [V4]. Confirm that the shortest usable passage offers clear analysed frames and that the result arrives by the agreed deadline.
| Condition | Failure mechanism | Required check |
|---|---|---|
| Low light and mode switching | Noise, slow exposure or focus shift | Moving plates at operating speed; exposure, gain and day/night focus |
| Sun, headlights and wet glare | Saturation or flare hides strokes | Demanding sun directions, approach paths and reflections |
| Infrared illumination | Weak or uneven return; reflective plate saturation | Beam coverage, near/far return, wavelength compatibility and focus |
| Rain, spray, fog and dust | Droplets, veiling and contrast loss | Observed severity, optical-window condition and plate detail |
| Occlusion and queues | Target partly or wholly hidden | Following gaps, truck traffic and adjacent lanes |
| Dirty, bent or damaged plates | Missing strokes and changed geometry | Independent truth and defect labels retained in scoring |
Plate Recognizer's capture guidance covers exposure and IR [V1-V2]; its difficult-image page demonstrates selected challenges [V3]. IR does not remove glare or weather effects. Test the imager, illumination and local plate materials together. Include interacting conditions, such as far-lane night capture in rain. A digitally darkened still image does not replace a moving-vehicle night test.
Match the test to the delivered evidence
| Boundary | Included | Boundary record |
|---|---|---|
| Generic camera capture | Optics, imaging sensor, exposure and illumination | Recorded plate detail at operational settings |
| Recognition engine | Detection and decoding of specified input | Input file and raw engine output |
| Configured XVision unit | Agreed sensing and processing up to its declared output | Device configuration and available event record |
| Whole system | Capture, recognition, filtering, association and final delivery | Correct records at the agreed evidence output |
The evaluation plan specifies available stage records; this table does not promise a particular implementation. Compare independent passages with source capture, engine events and delivered records wherever those records exist. Keep scheduled service availability separate from recognition during available periods, then report the whole-service outcome where the reference permits it. A missing service interval is not zero traffic.
Build ground truth without seeing system answers
Select observation blocks randomly or by a predeclared systematic schedule across representative days. Cover lanes, directions, peak/off-peak traffic, speeds, plate formats, lighting and weather. Oversample rare critical conditions, report them separately, and use independently justified population weights for any combined estimate.
Reviewers log each passage, target plate, time, lane, direction and condition without seeing predictions. Use authorised independent evidence when the operational image cannot establish the string. Double-review a predeclared subset and disputed cases, adjudicate differences and retain corrections. Keep tuning and acceptance periods separate, including repeated visits and adjacent frames.
Fix clock alignment, time zone, matching window and trajectory rules before comparison. Match with independent time/path evidence rather than predicted plate text. Retain unmatched outputs and ambiguous associations for the record audit.
Preserve the denominator when truth is difficult
N comes from the independent census, including in-scope misses and occlusion. Record vehicles without a target plate as a distinct category. An all-vehicle service rate retains them in N; a plate-present rate uses a separate declared population. D/N is detection yield per passage, not localisation recall when N includes absent plates.
When independent evidence cannot establish plate text, retain the passage in the census and label text truth unscorable. Report exact-read accuracy on the reference-known subset together with its coverage of N. Bound an all-passage estimate by treating unknown cases first as failures, then successes. Use authorised access, retention and handling rules; publish aggregates rather than identifying plate imagery.
Size the sample for the acceptance decision
Choose the metric, critical strata, confidence level, precision and acceptance rule first. Count independent passages, not repeated frames. Conditional exact-read accuracy needs enough detected plates D; planning from N alone understates that requirement. Allow for unusable truth records, repeated vehicles, platoons and site/time effects.
Illustrative numeric example: sample planning
A first planning approximation for a proportion is:
Using p = 0.5, desired half-width h = 0.03 and z = 1.96 for an approximate two-sided 95% interval gives n = 1,067.111..., rounded up to 1,068 independent passages. This is a planning illustration, not a universal test size or an acceptance threshold. Confirm final sample size against the intended interval across plausible outcomes. Plan each critical stratum separately. For a minimum-performance decision, also plan statistical power at a defensible alternative and the required lower confidence bound.
Wilson interval: inputs and calculation
NIST describes the Wilson interval for binomial proportions [N1]. For x successes in n independent trials, let p-hat = x/n. Calculate centre c and half-width w:
The interval is [c - w, c + w]. For Section 02: x = 900; n = 1,000; p-hat = 0.9; z = 1.96. The calculation gives c = 0.89846924 and w = 0.01862160. Limits are 0.87984764 and 0.91709084, or 87.98%-91.71%. The selected 95% confidence level is a reporting convention, not an accuracy target.
Report successes, denominator, interval method, confidence level and population with every rate. Use the agreed one-sided bound for one-sided acceptance. Zero observed errors still requires an upper error bound.
Correlation and stopping rules
Use a survey-aware analysis or resample whole independent blocks/sites when observations are clustered, preserving strata and weights. Declare block selection and check sensitivity. An unweighted binomial interval does not describe a weighted overall result. Predeclare stopping rules and multiple acceptance criteria; repeated testing until a pass overstates certainty. Intervals quantify sampling uncertainty, not biased truth or untested conditions.
Accept the configured site
| Step | Commissioning action | Evidence retained |
|---|---|---|
| 01 | Agree the task, target population, boundary, metrics and pass rules | Test plan and completed matrix |
| 02 | Survey the Australian capture envelope | Plate inventory, speeds, lens, range, angles and pixel measurements |
| 03 | Freeze settings and versions | Device/firmware/engine versions, exposure, regions, zones, thresholds and event rules |
| 04 | Collect independent reference blocks | Census, blind labels, truth coverage and adjudication |
| 05 | Match and score each declared boundary | D, R, E, wrong reads, no-reads, false detections, duplicates and output losses |
| 06 | Apply the acceptance rule | Per-stratum results, intervals, limitations and engineering decision |
| 07 | Correct and retest where required | Original failure, change record and fresh held-out test |
Set end-to-end exact-read and wrong-read criteria from the engineering task and error consequences. Specify whether each critical condition must pass and whether a confidence bound governs the decision. Include availability, timely delivery, duplicate handling and completeness where they affect the task. Strong daytime results do not offset a failed required night stratum.
Confidence scores are not measured accuracy
An engine score expresses model certainty about a prediction. It does not establish site accuracy or prove an individual registration. Select thresholds on development data, then freeze them for acceptance. On held-out data, compare score bands with observed exact-read proportions and plot accepted coverage against wrong-read rate. Increasing the threshold rejects some correct reads as well as errors; it cannot recover missed plates.
Plate Recognizer's Stream Health Score concerns processing performance on host hardware [V4]. Use it as an operational diagnostic, not an accuracy percentage. Recheck score calibration after engine or scene changes.
Audit output records as well as passages
Wrong accepted text differs from no output. For known-truth passages, report (R - E)/N and (N - R)/N, plus wrong reads among accepted strings, (R - E)/R. An empty denominator is not estimable. For all accepted output records, separately report the share that is exact and uniquely matched to a real target passage. Include unmatched false detections and duplicates in that audit; E/R in Section 02 excludes those extra records.
Define the permitted prediction delay and final-output deadline. Report timely correct records separately from eventually correct records. Test both under peak load. A cropped-image replay diagnoses an engine; acceptance of the installed system requires the agreed field evidence.
A reusable Australian field-test matrix
Complete the levels, sample design and acceptance criteria before testing. Split a row wherever a lane, direction or condition requires its own acceptance decision.
| Stratum | Scope to declare | Capture / condition record | Scoring evidence |
|---|---|---|---|
| Baseline day | Every lane/direction; speed bands in km/h | Near/far range, angles, plate and character pixels | N, D, R, E; rates and intervals |
| Night | Required speeds and vehicle classes | IR, focus, exposure, gain and glare | Separate night result |
| Dawn / dusk | Sun-facing and shaded paths | Sun direction, flare and mode changes | Wrong reads and no-reads |
| Wet / reduced visibility | Required traffic mix | Rain, spray, fog/dust and optical-window condition | Observed severity; stratum result |
| Geometry limits | Far lane, turns, grades and zone edges | Worst yaw/pitch/roll; smallest plate detail | Per-trajectory results |
| Congestion | Queues, close following and truck traffic | Occlusion and usable observation time | Census includes hidden targets; duplicates |
| Australian plate diversity | State/territory series, personalised, slimline, motorcycle, trailer, heavy vehicle and auxiliary | Dimensions, length, layout, reflectivity, dirt/damage | Independent text truth; exact text and jurisdiction correctness |
| Load and recovery | Peak demand, restart and missing service | Analysed frames, gaps and output timing | Engine versus delivered record; availability |
Result-sheet template
| Field | Complete for this test |
|---|---|
| Identity and scope | Test ID; site/unit; dates/time zone; lane/direction; target plate; reporting boundary |
| Capture and configuration | Plate inventory; range/angles; lens; speed bands; pixels; exposure/IR; versions/settings |
| Reference and selection | Block selection; truth source/review; eligibility; planned sample; weights; correlation |
| Counts | Scheduled/observed time; N; absent targets; known/unscorable truth; D; R; E |
| Errors and uncertainty | Wrong/no-reads; unmatched detections; duplicates; association/output loss; interval method/limits |
| Decision and traceability | Criterion; result; evidence file IDs; reviewer; change/retest ID; next review trigger |
Retain raw and normalised text, original outputs and corrections in the authorised evaluation record. The published result should state the numerator, denominator, conditions, uncertainty and decision without exposing identifying evidence.
Locate the failure, then test the correction
The examples below are illustrative mechanisms, not XVision trial observations. The plate string is synthetic.
| Failure example | Metric effect | Next check |
|---|---|---|
| ABC123 accepted as A8C123 | Detection success; wrong exact read | Character detail, saturation and score bands |
| Plate found but text rejected | D increases; R does not | Threshold coverage and rejection reasons |
| Far-lane motorcycle plate too small | Miss or misread | Actual engine-input pixels and lens/FOV |
| Night plate saturated white | No-read or confident wrong read | Exposure, IR return and moving-vehicle contrast |
| Truck hides the target | In-scope end-to-end failure | Occlusion, gaps and capture-zone coverage |
| Sign becomes a plate record | Unmatched false detection | Nuisance objects and detection zones |
| One passage produces repeated events | Duplicate records | Association and event-separation settings |
| Correct engine read never arrives | Whole-system failure | Stage logs, timing and service gaps |
| Results swapped between close vehicles | Association failure | Independent trajectories and clock alignment |
Retain the original failure, reference, condition and configuration. Tag causes after scoring; label live, replay and synthetic evidence separately. Exposure, lens, zone or threshold changes create a new configuration; confirm the correction on fresh evidence rather than deleting the original error.
Keep the accepted baseline visible
Set review frequency from operational risk, seasonal exposure and the cost of wrong records. Select rolling reference samples without inspecting successful reads first. Track end-to-end exact reads, wrong reads, no-reads, duplicates and truth coverage by lane and condition, using the commissioning definitions.
Repeat the relevant strata after changes to pose, lens, exposure, illumination, regions, thresholds, engine/firmware or event logic. Compare configurations on held-out reference material and verify the installed result. Preserve the last accepted baseline and every change record.
Detect deterioration before it changes the study
Inspect mounting movement, dirty optical windows, vegetation, new lighting, roadworks and changing traffic paths. Investigate falling plate pixels, rising rejected reads, unexpected formats, duplicate events and missing intervals. Record the owner, trigger and action for each check. A healthy processing score does not replace a reviewed sample of actual outcomes.
XVision field result: Casey Complex
The public Casey Complex case study reports the following result [X1]:
Validated over 26 April to 24 June 2023 across 18,310 dwell-time records from the three plate-reading units, achieving a 96.8% plate detection rate.
This is plate detection, not exact full-plate reading. It applies to that deployment and period. The quoted total counts dwell-time records. No passage denominator, plate count or exact-read rate is derived from it. Another site requires its own acceptance test.
Practical evaluator checklist
- Engineering question, target plate and output boundary agreed.
- Independent passage census includes misses and in-scope occlusion.
- Absent targets and unscorable truth are separately counted.
- Australian plate sizes, formats and character arrangements inventoried.
- End-to-end, conditional and accepted-read metrics show their counts.
- Exact-match, jurisdiction and alternative-candidate rules fixed.
- Wrong reads, no-reads, false detections and duplicates separated.
- Actual input pixels, angles, range, speed and exposure measured.
- Night, weather and demanding condition combinations tested.
- Reference review blind; disagreements and corrections retained.
- Development and acceptance data separated; configuration frozen.
- Sampling, weights, clustering, intervals and stopping rules declared.
- Delivered records and service gaps checked under operational load.
- Acceptance decision, owner and ongoing review triggers recorded.
A useful result statement names the site and period, population and truth coverage, configuration, system boundary, metric formula, numerator/denominator, interval, conditions, limitations and engineering decision. It keeps supplier guidance, evaluation targets and measured outcomes distinct.
Discuss a Location
Contact XVision to discuss your location, capture conditions and ANPR evaluation requirements.
Sources
All sources accessed 7 November 2026. The Australian authority sources describe their stated jurisdictions and series. Engine-supplier pages are reference guidance, not measured XVision performance. Installed engine versions belong in the site test record.
| ID | Source and context | Precise URL |
|---|---|---|
| A1 | Transport WA, State series plates. Dimensions and target classes; live page. | https://www.transport.wa.gov.au/licensing/plates/standard/state |
| A2 | WA DTMI, Optional Plates/Remake Application, pp.1-3; updated 30 March 2026. Dimensions, character counts and formats. Read in full. | https://transport.wa.gov.au/getmedia/d226c7d9-af3d-401d-bd0f-dd7b09d02ed2/LBU_F_Plates_Optional.pdf |
| A3 | Queensland Government, Step up to the plate for a piece of QLD motoring history, 21 July 2020. Series-format announcement, not an issue-status forecast. | https://statements.qld.gov.au/statements/90234 |
| N1 | NIST Dataplot, Proportion Confidence Limits. Wilson/binomial interval methods; displayed update 12/11/2023. | https://www.itl.nist.gov/div898/software/dataplot/refman1/auxillar/propconf.htm |
| V1 | Plate Recognizer, Best ANPR Camera System Setup. Engine-supplier capture guidance; live, no engine build specified. | https://platerecognizer.com/camera-setup-for-best-anpr/ |
| V2 | Plate Recognizer, LPR Camera Resolution Guide. Pixels, field of view and exposure planning; live, no engine build specified. | https://platerecognizer.com/lpr-camera-resolution-guide/ |
| V3 | Plate Recognizer, ALPR Results in the Real World. Selected-image demonstrations, including resized/rotated and altered images; not a representative site sample. | https://platerecognizer.com/alpr-results/ |
| V4 | Plate Recognizer, Stream FAQ. Effective frame rate, delay and host-processing health; live, no deployed version asserted. | https://guides.platerecognizer.com/docs/stream/help/faq/ |
| X1 | XVision, Casey Complex: Stay Time and Car Park Use. Public field-result source for the stated 2023 deployment and period. | https://xvision-ai.com/blog/case-study-casey-complex-parking-stay-time |
NIST supports interval calculation, not the traffic sample design. The sample, matching and acceptance procedures are the framework defined in this paper. The illustrative calculations use their stated inputs; they are separate from Casey Complex.