
Resource Library
CASE STUDY: How the City of Stonnington Built One of Australia's Most Advanced Road Intelligence Networks
By Simon Maselli
- Case Study
- City of Stonnington
- Location Intelligence
- Evidence Frameworks
- Safety Risk

Executive Summary
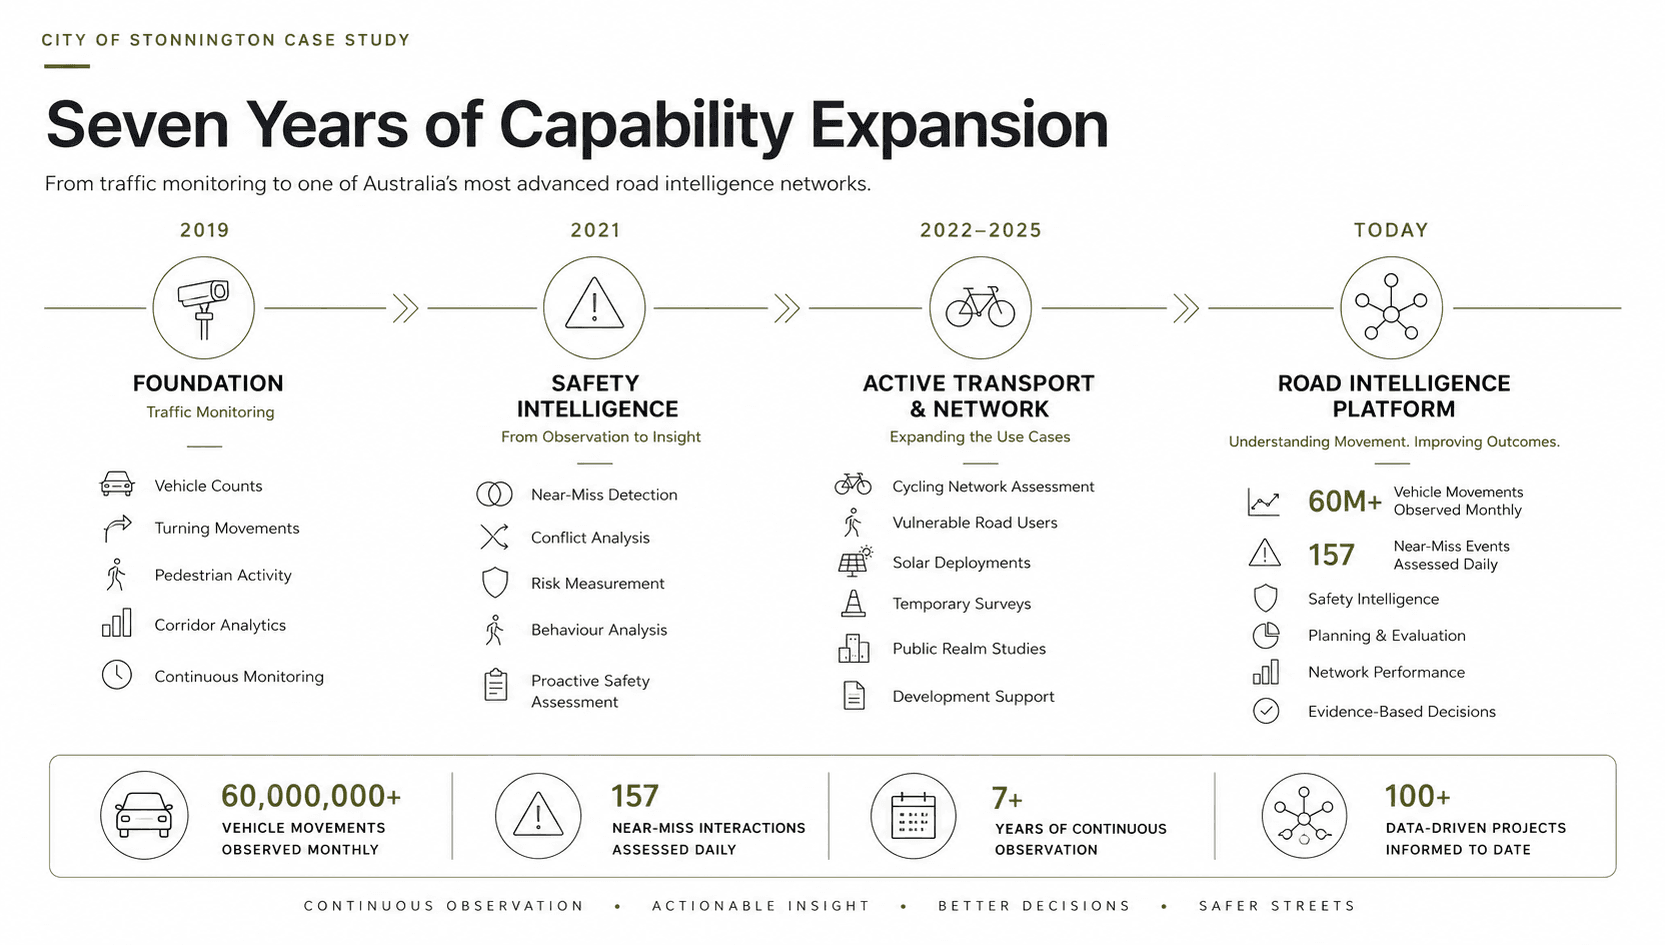
The City of Stonnington has partnered with XVision for more than seven years to develop one of Australia's most mature municipal infrastructure intelligence networks.
What began in 2019 as the replacement of a fragmented traffic monitoring system has evolved into a municipality-wide platform for understanding movement, measuring risk and supporting evidence-based transport planning.
The deployment commenced with one roadside intelligence unit along Melbourne's iconic Chapel Street corridor. Initially focused on continuous traffic monitoring and data collection, the network has since grown to more than 40 units alongside temporary deployments, near-miss analytics, vulnerable road user monitoring, cycling corridor assessments and municipal-scale behavioural analysis.
Today, the network continuously monitors more than 60 million vehicle movements every year while assessing approximately 157 near-miss interactions each day across vehicles, cyclists and pedestrians.
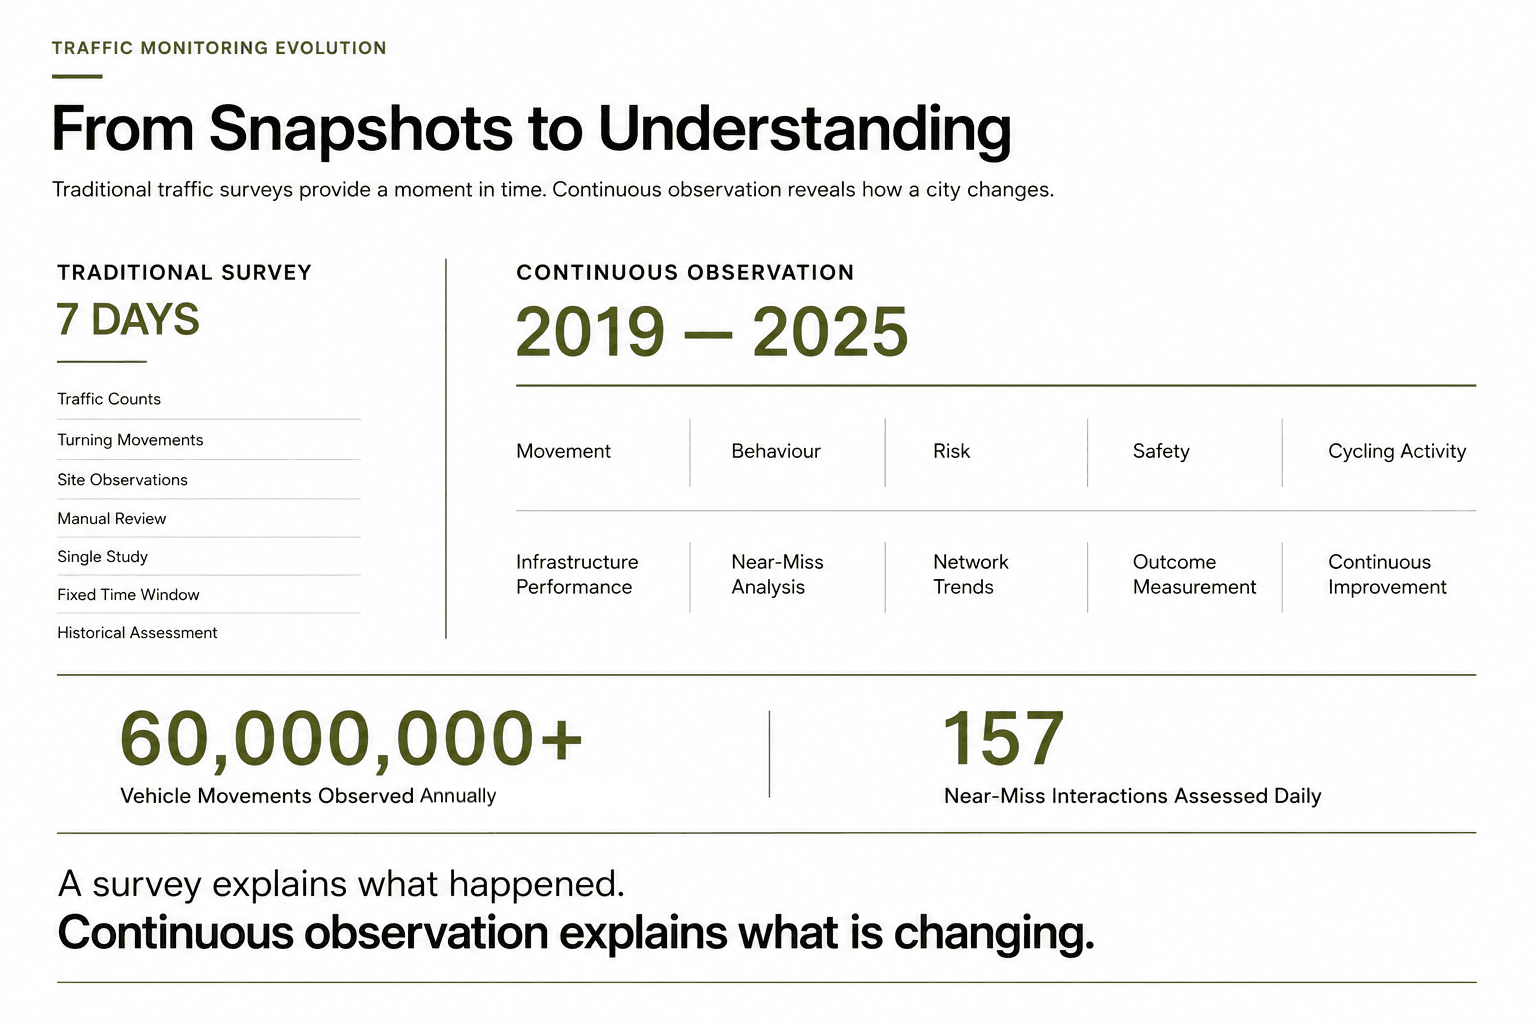
Unlike traditional traffic surveys, which provide only a short-term snapshot of activity, the Stonnington deployment provides a continuous record of how people move through one of Melbourne's most complex urban environments. This allows Council to understand long-term trends, evaluate infrastructure investments, support active transport planning and identify emerging safety risks before they appear in crash statistics.
The network now supports a broad range of municipal objectives including traffic operations, road safety, active transport planning, development assessment, public realm improvements and vulnerable road user protection.
Importantly, the project demonstrates the evolution of municipal infrastructure intelligence from isolated counting systems to a continuous evidence platform capable of supporting strategic decision-making across an entire municipality.
Project Outcomes
- 7+ years of continuous network operation
- 40+ roadside units in operation, plus temporary deployments
- 60 million+ vehicle movements monitored each year
- 157 near-miss events assessed daily
- Permanent and temporary deployment capability
- Support for Cycling Strategy 2020–2025 objectives
- Evidence-based planning and infrastructure evaluation
- Road safety, compliance and behavioural insights
- One of Australia's most mature municipal road intelligence deployments
The Challenge
Replacing a Fragmented Monitoring Network
Prior to the deployment of XVision infrastructure, the City of Stonnington operated a single traffic monitoring node that reflected the state of intelligent transport systems at the time.
The system was progressive for its era. It provided Council with visibility of traffic activity across it's key location and supported the collection of operational data used for planning and analysis.
However, achieving this capability required multiple independent components.
Separate cameras, communications equipment, processing hardware and supporting infrastructure were combined to create a functioning monitoring network. While effective, the approach introduced complexity into both deployment and ongoing maintenance.
Expanding coverage often required significant installation effort, additional roadside infrastructure and specialised integration between multiple systems.
As Council's transport priorities evolved, several challenges became increasingly apparent.
Key Challenges
Limited Scalability
Expanding the network required substantial infrastructure investment and complex deployment activities. Each new location effectively became a standalone project.
Point-in-Time Intelligence
While the network provided valuable monitoring capability, it was primarily focused on counting and movement data. Understanding behaviour, interaction and risk remained largely dependent on targeted studies and manual review.
Growing Demand For Active Transport Data
Cycling participation, pedestrian activity and public realm improvements were becoming increasingly important considerations within municipal planning. Existing monitoring approaches were not designed to continuously measure these activities at scale.
Evidence Requirements Increasing
Transport planning decisions were becoming increasingly evidence-driven. Council required reliable data to support funding applications, infrastructure prioritisation, community engagement and strategic planning initiatives.
Diverse Operating Environments
Stonnington presents a particularly challenging urban environment.
Within a relatively small municipality, Council manages:
- Major arterial corridors.
- Dense retail precincts.
- Tram corridors.
- High pedestrian activity areas.
- Strategic cycling routes.
- Local residential streets.
- School environments.
- Mixed-use activity centres.
Each environment generates different movement patterns, operational challenges and safety considerations.
A monitoring solution needed to operate consistently across all of them.
Beyond Traffic Counting
Perhaps the most significant challenge was that transport planning itself was changing.
Historically, traffic monitoring systems were primarily designed to answer a relatively simple question:
How many vehicles are using a road?
By 2019, Council's requirements had expanded considerably.
Questions increasingly included:
- How are pedestrians using public space?
- Where are cyclists choosing to travel?
- Which locations experience recurring safety issues?
- How do behaviours change over time?
- Are infrastructure investments delivering measurable outcomes?
- Where should future investment be prioritised?
Answering these questions required more than a traditional counting system.
It required a platform capable of continuously observing movement, understanding behaviour and generating evidence across the entire municipality.
A Different Approach
Rather than replacing individual components of the legacy system, the City of Stonnington chose to establish a new foundation for municipal transport intelligence.
The objective was to create a scalable platform capable of evolving alongside Council's transport, safety and active transport objectives over the coming decade.
The first step in that journey would begin on one of Melbourne's most complex and recognisable urban corridors: Chapel Street.
Building the Foundation (2019)
Chapel Street: Establishing a Continuous Observation Network
In 2019, the City of Stonnington commenced the first stage of what would become a municipality-wide infrastructure intelligence network.
The initial deployment focused on Chapel Street, one of Melbourne's most recognisable and operationally complex urban corridors.
Extending approximately two kilometres through the municipality, Chapel Street serves multiple functions simultaneously. It operates as a retail destination, hospitality precinct, commuter corridor, public transport route and pedestrian activity centre. The corridor experiences highly variable traffic conditions throughout the day, with significant changes in activity between commuter periods, trading hours, evening economy activity and weekends.
From a transport planning perspective, Chapel Street presented an ideal environment to establish a new generation of monitoring capability.
Why Chapel Street?
Unlike many municipal roads that serve a single dominant purpose, Chapel Street supports a diverse mix of road users competing for limited space.
This includes:
- General traffic movements.
- Tram operations.
- Pedestrian activity.
- Cyclists.
- Delivery vehicles.
- Ride-share and taxi activity.
- Kerbside loading operations.
- Short-term parking demand.
Understanding how these users interact is inherently more complex than simply measuring vehicle volumes.
The corridor generates a constant flow of competing movements, making it an important location for understanding how transport networks function within high-activity urban environments.
The Initial Deployment
The first stage of the project involved the installation of one permanent roadside monitoring unit along the Chapel Street corridor.
At the time, this represented a significant evolution from the fragmented legacy architecture previously used by Council.
Rather than deploying multiple independent components, the new system consolidated sensing, processing and communications into a single integrated roadside platform.
The objective was straightforward:
Establish a continuous source of reliable movement data across one of the municipality's most important transport corridors.
The deployment provided Council with visibility into:
- Vehicle volumes.
- Turning movements.
- Pedestrian activity.
- Temporal demand patterns.
- Corridor utilisation.
- Traffic distribution across the day.
Importantly, this information was no longer limited to short-duration traffic studies.
For the first time, Council could observe how movement patterns evolved continuously over time.
A Different Type of Dataset
Traditional transport surveys provide a snapshot.
A survey may capture seven days of activity, two weeks of activity or a single observation period.
While valuable, these studies are inherently limited by their duration.
The Chapel Street deployment introduced a fundamentally different approach.
Instead of collecting samples of behaviour, Council began building a continuous operational record of corridor performance.
This distinction would become increasingly important in the years that followed.
Rather than asking:
"What happened during the survey period?"
Engineers could begin asking:
- How has activity changed over six months?
- How does behaviour vary seasonally?
- What impact did a major event have on movement patterns?
- Are trends increasing or decreasing over time?
The deployment established a long-term evidence base rather than a series of isolated observations.
Unintended Timing: The Arrival of COVID-19
Shortly after the deployment was completed, Melbourne entered one of the most significant disruptions to urban mobility in modern history.
COVID-19 dramatically altered movement patterns throughout the municipality.
Traffic volumes changed.
Pedestrian activity shifted.
Retail activity was disrupted.
Travel demand fluctuated across multiple lockdown periods.
While these conditions were unforeseen, they highlighted an unexpected benefit of continuous monitoring.
Rather than relying on assumptions or anecdotal observations, Council possessed objective data describing how movement patterns were changing throughout the disruption.
The network captured not only normal operating conditions but also one of the most significant transport behaviour shifts ever experienced within the municipality.
Establishing the Foundation
Although the initial deployment was primarily focused on monitoring and data collection, it established something more important.
It created the foundation for future capability.
The infrastructure was no longer limited to counting road users.
It provided a platform capable of evolving as Council's requirements evolved.
Over the following years, this same network would expand beyond traffic monitoring to include behavioural analysis, vulnerable road user assessment, near-miss detection and broader municipal intelligence functions.
What began as a corridor monitoring project was rapidly becoming a long-term infrastructure asset.
The next stage of that evolution would focus on a different question:
Not simply how people moved through the network, but how safely they interacted within it.
From Counting to Understanding Risk (2021)
Introducing Near-Miss Analytics
By 2021, the City of Stonnington had established a continuous monitoring network across key transport corridors.
The system was successfully collecting movement data and providing a reliable understanding of how road users interacted with the network over time.
However, an important limitation remained.
Traditional monitoring systems are highly effective at measuring demand.
They can quantify:
- Traffic volumes.
- Turning movements.
- Pedestrian activity.
- Cyclist activity.
- Corridor utilisation.
- Temporal demand patterns.
What they typically cannot quantify is risk.
For transport engineers, this distinction is significant.
Understanding how many people use an intersection does not necessarily explain how safely it is operating.
Similarly, locations with relatively low crash histories may still exhibit operational characteristics associated with elevated safety risk.
This challenge is particularly relevant in urban environments where pedestrians, cyclists, public transport and vehicles operate within constrained spaces.
Moving Beyond Crash Statistics
Historically, safety assessment has relied heavily on crash records.
While essential, crash statistics have an inherent limitation.
They describe realised outcomes.
They do not necessarily describe the underlying conditions that contributed to those outcomes.
In practice, many hazardous interactions occur without resulting in a reported crash.
Examples include:
- Vehicles failing to yield to pedestrians.
- Close-proximity turning conflicts.
- Cyclist and vehicle interactions.
- Aggressive gap acceptance behaviour.
- Late braking events.
- Encroachments into conflict zones.
These events may occur repeatedly before eventually contributing to a collision.
The challenge for transport agencies has traditionally been measuring them at scale.
Introducing Near-Miss Analytics
In 2021, Stonnington upgraded the network to include near-miss detection and conflict analysis capabilities.
This represented a fundamental shift in the purpose of the infrastructure.
The network was no longer solely measuring movement.
It was now assessing interaction.
Using trajectory analysis and conflict detection methodologies, the system became capable of identifying road user interactions associated with elevated safety risk.
The objective was not to predict crashes.
The objective was to identify recurring conflict patterns before they appeared in crash statistics.
This provided Council with a new layer of safety evidence that had previously been difficult to collect continuously.
Measuring Safety Exposure
The introduction of near-miss analytics enabled engineers to move beyond traditional outcome-based assessment.
Instead of focusing solely on recorded collisions, the network could begin measuring exposure to risk.
Key observations included:
Frequency of vehicle-pedestrian conflicts.
Frequency of vehicle-cyclist conflicts.
Conflict severity.
Location-specific interaction patterns.
Time-of-day risk variation.
Recurring behavioural trends.
These indicators provide insight into how road users interact within the network, not simply how many users are present.
This distinction is particularly important when evaluating locations with significant vulnerable road user activity.
Supporting Vulnerable Road User Safety
The City of Stonnington contains a diverse mix of pedestrian environments, cycling routes, retail precincts and public transport corridors.
Many of these locations experience relatively low crash frequencies but high levels of interaction between different road user groups.
Traditional crash analysis alone may not fully capture these conditions.
Near-miss analytics provides an additional evidence source.
By measuring interactions rather than waiting for collisions, Council gained greater visibility into locations where:
Pedestrians experienced repeated conflicts with vehicles.
Cyclists encountered turning traffic.
Operational conditions changed over time.
Emerging risks were developing.
This supported a more proactive approach to safety assessment.
Building a Continuous Safety Dataset
One of the most significant outcomes of the upgrade was the creation of a continuous safety dataset.
Historically, conflict studies were typically undertaken as short-duration investigations.
Engineers would conduct site observations, review video footage or commission targeted assessments.
While valuable, these studies were limited in duration and scale.
The upgraded network enabled conflict monitoring to occur continuously.
Today, approximately 157 near-miss incidents are recorded and assessed each day across the Stonnington deployment.
This provides a substantially larger evidence base than would be practical through manual observation alone.
More importantly, it allows trends to be monitored over time.
Engineers can assess whether risk is:
- Increasing.
- Decreasing.
- Concentrated within specific locations.
- Associated with particular movements.
- Influenced by infrastructure changes.
A New Layer of Municipal Intelligence
The introduction of near-miss analytics marked an important transition in the evolution of the network.
The original deployment had established the ability to measure movement.
The 2021 upgrade established the ability to measure interaction and risk.
This expanded the role of the infrastructure from a monitoring system to a safety intelligence platform.
It also laid the foundation for the next stage of network expansion, where continuous monitoring would increasingly focus on vulnerable road users, cycling infrastructure and the strategic objectives outlined within the City's Cycling Strategy.
By understanding not only how people moved, but how they interacted, Council gained access to a richer and more actionable view of network performance.
Supporting Active Transport Objectives (2022–2025)
Expanding Across the Cycling Network
Following the introduction of near-miss analytics in 2021, the focus of the Stonnington network expanded beyond corridor monitoring and towards broader municipal transport objectives.
A key driver of this expansion was the City's commitment to active transport and the delivery of its Cycling Strategy 2020–2025.
The strategy recognised that cycling would play an increasingly important role within the municipality and identified a series of objectives aimed at improving safety, accessibility and participation. These included creating safer cycling environments, supporting strategic cycling corridors, improving conditions for riders of varying ages and abilities, and encouraging greater uptake of active transport across the municipality.
Delivering these objectives required more than infrastructure investment alone.
It required evidence.
Council needed a reliable understanding of how cyclists were using the network, where conflicts were occurring and how behaviour changed over time.
From Corridor Monitoring to Network Monitoring
The original Chapel Street deployment provided visibility into a single high-profile corridor.
The next phase expanded monitoring across the municipality's broader cycling network.
This included a combination of permanent and temporary deployments positioned along:
- Strategic cycling corridors.
- Shared user paths.
- Pedestrian crossing points.
- Active transport connections.
- High cyclist demand locations.
- Emerging cycling routes.
The objective was not simply to count cyclists.
The objective was to understand how the cycling network was functioning as a system.
Questions increasingly included:
- Which routes were experiencing growth?
- Where were cyclists interacting with vehicles?
- Which crossings created delay or risk?
- Where were infrastructure improvements influencing behaviour?
- Which corridors should be prioritised for future investment?
These questions required continuous observation rather than periodic surveys.
Measuring Vulnerable Road User Activity
Historically, many transport datasets have been heavily focused on vehicles.
While vehicle movements remain important, the Cycling Strategy placed increasing emphasis on vulnerable road users and active transport outcomes.
The expanded network enabled Council to continuously monitor:
- Cyclist volumes.
- Pedestrian volumes.
- Shared path activity.
- Crossing demand.
- Road user interactions.
- Near-miss events involving vulnerable road users.
- Temporal and seasonal trends.
This provided a significantly richer understanding of how public space was being used throughout the municipality.
Importantly, it enabled active transport activity to be measured with the same consistency traditionally applied to vehicle traffic.
Supporting Evidence-Based Infrastructure Planning
One of the key challenges facing transport agencies is demonstrating where infrastructure investment will deliver the greatest benefit.
Traditional planning approaches often rely on a combination of:
- Community feedback.
- Site observations.
- Short-duration surveys.
- Historical crash records.
While valuable, these sources can be limited in both duration and scale.
The Stonnington network introduced a continuous evidence layer that could support planning decisions across multiple years.
Rather than relying on a single survey period, Council could assess:
- Long-term demand trends.
- Changes in route utilisation.
- Growth in cycling activity.
- Emerging safety concerns.
- Network-wide movement patterns.
This improved the quality of evidence available to support both planning and investment decisions.
Measuring Infrastructure Outcomes
An equally important outcome was the ability to evaluate infrastructure performance after implementation.
Historically, transport projects have often been assessed through isolated before-and-after studies or community feedback.
The expanded monitoring network provided a more robust evaluation framework.
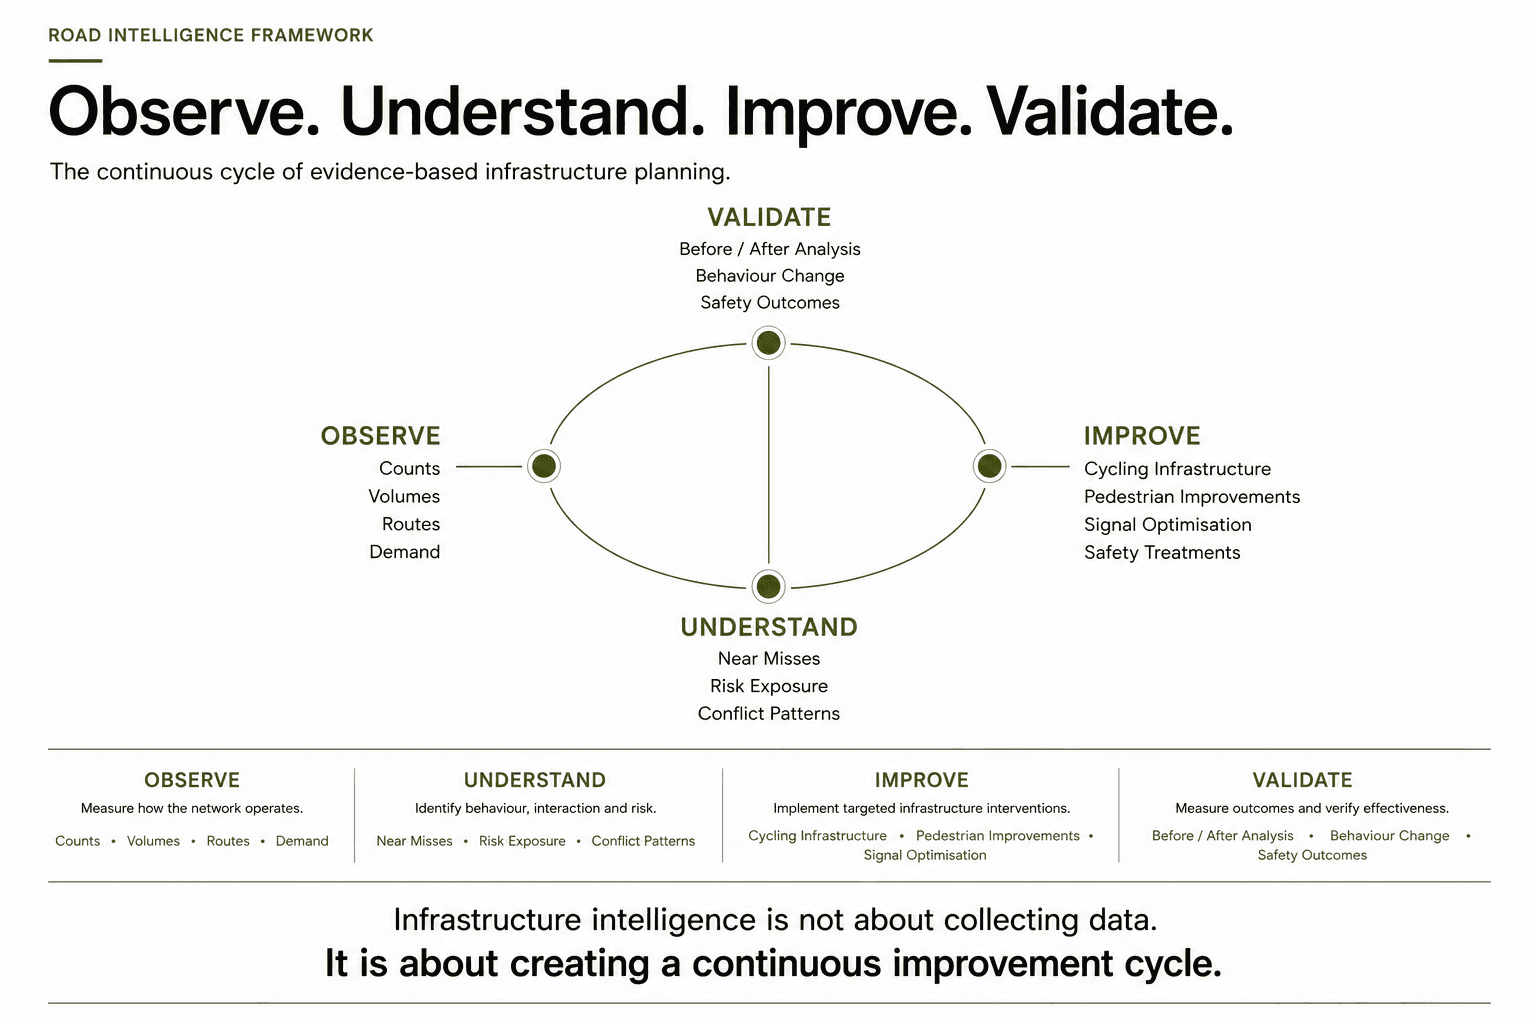
Council could establish baseline conditions before an intervention and continue monitoring after implementation.
This enabled assessment of:
- Changes in cyclist volumes.
- Changes in pedestrian activity.
- Changes in route choice.
- Changes in conflict frequency.
- Changes in road user behaviour.
- Changes in exposure to risk.
The result was a stronger evidence base for understanding whether investments were achieving their intended outcomes.
Deploying in Challenging Urban Environments
Expanding the network across Stonnington presented a number of practical challenges.
Unlike greenfield environments, many areas within the municipality are characterised by constrained streetscapes, mature urban form and limited available roadside infrastructure.
Locations such as Bangs Street and surrounding precincts presented particular challenges.
These environments often included:
- Narrow footpaths.
- Limited mounting opportunities.
- Heritage-sensitive streetscapes.
- High pedestrian activity.
- Restricted access to permanent power.
To support monitoring in these locations, the network incorporated a combination of mains-powered and solar-powered deployments.
This provided flexibility in site selection while minimising the need for extensive civil works or permanent infrastructure modifications.
The ability to deploy temporary sensors also enabled Council to investigate locations that would not otherwise justify permanent installations.
Informing Public Realm Improvements
The expanded monitoring capability was not limited to transport planning alone.
Data collected across the network contributed to broader public realm and urban design initiatives.
Particular focus was placed on understanding how pedestrians moved through constrained environments and how public space was being utilised.
This supported investigations into:
- Pedestrian cut-throughs.
- Walking connections.
- Crossing demand.
- Footpath utilisation.
- Allocation of public space.
- Accessibility improvements.
In these environments, movement data provided an evidence base for decisions that extended beyond traffic operations and into the design of the public realm itself.
Building Municipal-Scale Intelligence
By 2025, the Stonnington deployment had evolved well beyond its original purpose.
What began as a corridor monitoring project had become a municipality-wide observation network supporting multiple strategic objectives simultaneously.
The system was no longer measuring a single corridor.
It was helping Council understand how people moved throughout an entire municipality.
This represented a significant shift in capability.
Rather than commissioning individual studies to answer individual questions, Council had begun building a continuous evidence platform capable of supporting planning, safety and active transport decisions at network scale.
The result was a more complete understanding of how infrastructure was performing, how behaviour was changing and where future investment could deliver the greatest benefit.
From Surveys to Continuous Intelligence
Why Long-Term Observation Changed Decision Making
One of the most significant outcomes of the Stonnington deployment was not the technology itself.
It was the transition from periodic observation to continuous measurement.
Historically, transport planning has relied heavily on discrete data collection exercises.
Engineers identify a problem, commission a survey, collect data and develop recommendations based on the observations available at that point in time.
This approach remains valuable and continues to play an important role in transport planning.
However, it also has limitations.
A seven-day survey provides a snapshot.
A continuous monitoring network provides operating history.
The distinction becomes increasingly important as transport networks become more complex and infrastructure investments become more difficult to justify.
The Limitations of Traditional Surveys
Most transport practitioners are familiar with the challenges associated with point-in-time data collection.
A survey may be influenced by:
- School holidays.
- Seasonal variation.
- Weather conditions.
- Roadworks.
- Special events.
- Construction activity.
- Public transport disruptions.
- Temporary changes in travel behaviour.
While these influences are generally understood, they can make it difficult to determine whether observed conditions are representative of longer-term network performance.
The challenge becomes even greater when assessing behavioural change.
Questions such as:
- Is cycling participation increasing?
- Has a safety intervention improved conditions?
- Are pedestrians changing route choice?
- Is a corridor becoming busier or quieter?
often require observation periods extending well beyond a traditional survey window.
Building a Continuous Evidence Base
The Stonnington network introduced a different approach.
Instead of collecting data only when a study was commissioned, infrastructure continuously observed how the network was operating.
Over time, this created a growing evidence base describing:
- Movement patterns.
- Behavioural trends.
- Corridor performance.
- Vulnerable road user activity.
- Safety exposure.
- Infrastructure utilisation.
The value of the network increased with every month of operation.
Each new observation contributed to a deeper understanding of how the municipality functioned.
Understanding Change Over Time
One of the most important benefits of continuous observation is the ability to measure change.
Transport infrastructure is rarely static.
Land use changes.
Population grows.
Travel behaviour evolves.
New infrastructure is introduced.
Road space is reallocated.
Community expectations shift.
Without long-term data, these changes can be difficult to quantify.
The Stonnington deployment provided a mechanism for understanding how the network evolved over time.
Rather than asking:
"What happened during the survey period?"
Council could begin asking:
- What has changed over the past twelve months?
- How has cyclist demand evolved since infrastructure upgrades?
- Are pedestrian volumes increasing?
- Has conflict frequency reduced following intervention?
- Which corridors are experiencing the strongest growth?
These questions are fundamentally different from those traditionally addressed through traffic surveys.
Scale of Observation
Today, the network records more than 60 million vehicle movements each year across the municipality.
This scale of observation provides a level of insight that would be difficult to achieve through conventional survey programs alone.
Importantly, the value is not the volume of data itself.
The value is the ability to establish context.
A single survey may identify an issue.
Continuous observation provides an understanding of whether that issue is:
- Isolated.
- Persistent.
- Increasing.
- Decreasing.
- Seasonal.
- Network-wide.
This additional context supports more informed decision making.
Supporting Evidence-Based Investment
Transport agencies face increasing pressure to demonstrate that infrastructure investment delivers measurable outcomes.
Funding decisions must often compete against multiple priorities, requiring a clear evidence base to support investment.
Continuous monitoring assists this process in several ways.
It enables:
- Baseline conditions to be established before intervention.
- Performance to be measured after implementation.
- Trends to be monitored over time.
- Benefits to be quantified using observed behaviour.
This strengthens the connection between planning decisions and measurable outcomes.
Moving Beyond Individual Projects
Perhaps the most significant shift was organisational rather than technical.
Historically, data collection was often associated with a specific project.
A survey was undertaken to answer a specific question.
Once the project concluded, the data collection typically stopped.
The Stonnington network introduced a different model.
The infrastructure became a permanent source of evidence capable of supporting multiple projects simultaneously.
Traffic operations.
Road safety.
Cycling infrastructure.
Development assessment.
Public realm improvements.
Strategic planning.
All could draw upon the same underlying evidence base.
This reduced duplication while improving consistency across decision-making processes.
Municipal Intelligence at Scale
By 2025, the network had evolved beyond a collection of monitoring locations.
It had become an operational asset supporting the ongoing management of the municipality.
The transition from periodic surveys to continuous observation fundamentally changed how movement, behaviour and risk could be understood.
Rather than collecting data to answer individual questions, Council had established the ability to continuously observe how the network was performing.
This capability would prove increasingly valuable as the municipality sought to evaluate infrastructure outcomes, prioritise future investment and support long-term transport planning objectives.
The result is not simply more data. It is better evidence.
Measuring Outcomes and Informing Decisions
From Data Collection to Evidence-Based Planning
As the Stonnington network matured, the value of the deployment increasingly shifted from data collection towards decision support.
The objective was no longer simply to understand how many road users were present within the network.
The objective was to understand how infrastructure was performing, where investment was required and whether interventions were delivering measurable outcomes.
This distinction is important.
Data collection is an activity.
Decision making is an outcome.
The long-term value of municipal intelligence infrastructure is ultimately determined by its ability to support better planning, safer streets and more informed investment decisions.
Supporting Infrastructure Planning
One of the primary applications of the network has been the provision of evidence to support transport planning and infrastructure development.
Historically, many planning decisions relied upon a combination of:
- Traffic surveys.
- Site inspections.
- Community feedback.
- Stakeholder consultation.
- Historical crash records.
These inputs remain important.
However, continuous monitoring introduced an additional evidence layer capable of validating observations with long-term behavioural data.
This enabled Council to assess:
- How roads were being used.
- How public space was functioning.
- Where demand was changing.
- Where risk was emerging.
- Which corridors were experiencing growth.
Importantly, decisions could be informed by observed behaviour rather than assumptions.
Supporting Active Transport Investment
As investment in cycling and pedestrian infrastructure increased across the municipality, the network provided a mechanism for measuring both demand and performance.
Engineers could evaluate:
- Cyclist volumes.
- Route utilisation.
- Pedestrian activity.
- Crossing demand.
- Shared path usage.
- Conflict frequency.
- Exposure to risk.
This supported a more objective assessment of active transport infrastructure and enabled investment decisions to be grounded in measurable network performance.
The ability to establish baseline conditions prior to implementation and monitor outcomes afterwards provided a stronger framework for project evaluation.
Informing Public Realm Improvements
The network also contributed to broader public realm initiatives.
In highly constrained urban environments, understanding how people move through public space is often as important as understanding vehicle traffic.
Temporary and permanent deployments were used to better understand:
- Pedestrian desire lines.
- Informal crossing behaviour.
- Footpath utilisation.
- Movement through activity centres.
- Connections between destinations.
Particularly within older parts of the municipality, including areas around Bangs Street and surrounding precincts, this information contributed to investigations into improved pedestrian connectivity, additional walking space and safer movement through constrained urban environments.
These assessments extended beyond transport operations and into broader place-making and urban design outcomes.
Supporting Development Assessment
The network also provided valuable support for development-related investigations.
Growth and redevelopment continue to reshape activity patterns throughout Stonnington.
Understanding how proposed developments may influence transport demand is an important component of the planning process.
Temporary deployments enabled Council to collect site-specific evidence relating to:
- Traffic generation.
- Pedestrian activity.
- Cyclist demand.
- Kerbside utilisation.
- Operational behaviour.
This provided a more robust understanding of existing conditions and supported informed assessment of future impacts.
Safety Intelligence and Risk Assessment
The introduction of near-miss analytics significantly expanded the role of the network within road safety planning.
Traditional safety analysis often relies upon crash history as the primary evidence source.
While essential, crash records provide information only after an incident has occurred.
The Stonnington network introduced a complementary evidence source by continuously measuring interactions between road users.
Approximately 157 near-miss events are now assessed each day across the deployment.
This allows engineers to identify:
- Recurring conflict locations.
- Vulnerable road user exposure.
- High-risk movement patterns.
- Emerging safety concerns.
- Changes in risk over time.
The result is a richer understanding of network safety performance and an improved ability to prioritise investigation and intervention.
Compliance and Operational Insights
Beyond planning and safety applications, the network has also generated operational insights relevant to compliance and network management.
Examples include:
- Wrong-way movements on one-way streets.
- Speed-related behavioural trends.
- Repeated non-compliant movements.
- Unusual behavioural patterns.
This information has been shared with relevant stakeholders to support investigation and enforcement activities where appropriate.
The objective is not to replace enforcement systems.
Rather, it is to provide network intelligence capable of identifying locations and behaviours that may warrant further attention.
Measuring What Matters
Perhaps the most significant outcome of the Stonnington deployment has been the ability to move beyond isolated datasets and towards continuous performance measurement.
Rather than relying solely on assumptions, observations or short-duration studies, Council now has access to a long-term evidence platform capable of measuring how infrastructure performs in real-world conditions.
Questions that were previously difficult to answer can now be addressed through observed data:
- Is a corridor becoming safer?
- Are more people cycling?
- Are infrastructure investments working?
- Where should future investment be prioritised?
- Which locations are exhibiting increasing risk?
The ability to answer these questions consistently over time represents a significant shift in capability.
The network is no longer simply observing the municipality.
It is helping Council understand how the municipality is changing.
Why Stonnington Matters
A Blueprint for Municipal Infrastructure Intelligence
The City of Stonnington deployment is significant not because of the number of devices installed, but because of the breadth of outcomes the network now supports.
Over more than six years, the deployment evolved from a corridor-based traffic monitoring project into a municipality-wide intelligence platform supporting planning, safety, active transport, development assessment and public realm decision-making.
In many respects, the project reflects the broader evolution occurring across local government.
Historically, traffic monitoring systems were deployed to answer a specific question.
How many vehicles use a road?
How many people cross an intersection?
How many cyclists use a corridor?
The resulting data was typically collected for a specific project and then archived once the study was complete.
The Stonnington deployment demonstrates a different model.
Infrastructure intelligence becomes a permanent municipal capability rather than a project-specific activity.
A Municipality of Contrasts
Stonnington provides a uniquely challenging operating environment.
Within a relatively small geographic area, the municipality contains:
- Major arterial roads.
- Dense retail precincts.
- Tram corridors.
- Activity centres.
- Strategic cycling routes.
- High pedestrian demand areas.
- School environments.
- Residential neighbourhoods.
- Mixed-use developments.
- Night-time economy destinations.
Few municipalities experience such a diverse mix of transport conditions within a single network.
As a result, infrastructure deployed within Stonnington must operate effectively across a wide variety of environments and use cases.
The network has supported monitoring within:
- Chapel Street retail environments.
- Cycling corridors.
- Shared path networks.
- Signalised intersections.
- Pedestrian activity centres.
- Temporary survey locations.
- Development assessment sites.
- Solar-powered roadside deployments.
This diversity has made Stonnington an effective proving ground for municipal-scale infrastructure intelligence.
Beyond Counting
One of the most important lessons from the deployment is that the value of intelligent infrastructure is not derived from data volume alone.
It is derived from the ability to understand context.
The network currently monitors more than 60 million vehicle movements each year.
While this scale is significant, the real value lies in what can be learned from long-term observation.
For example:
- How demand changes over time.
- How road users respond to infrastructure investment.
- Where risk is increasing.
- Where safety outcomes are improving.
- Which corridors are becoming more important.
- How public space is being utilised.
These questions are fundamentally different from those traditionally addressed through traffic counting programs.
They represent a shift from measurement towards understanding.
From Projects to Platforms
A recurring challenge for local government is that transport data is often collected separately for individual projects.
One project commissions a survey.
Another project commissions a different survey.
A third project collects additional data.
Over time, substantial information is generated but often remains fragmented.
The Stonnington approach demonstrates the benefits of establishing a common evidence platform.
The same infrastructure supports:
- Transport planning.
- Active transport programs.
- Road safety initiatives.
- Development assessment.
- Public realm projects.
- Compliance investigations.
- Infrastructure evaluation.
This creates consistency across decision-making processes while reducing duplication of effort.
More importantly, it allows information collected for one purpose to create value across many others.
Measuring Change
Perhaps the most significant outcome is the ability to measure change.
Transport networks are constantly evolving.
Population grows.
Development occurs.
Travel behaviour shifts.
Infrastructure is upgraded.
Policy priorities change.
Understanding these changes requires more than isolated observations.
It requires continuity.
The Stonnington deployment has created a long-term record of movement, behaviour and risk across the municipality.
This enables Council to move beyond simply identifying issues and towards measuring whether interventions are delivering their intended outcomes.
For transport practitioners, this represents one of the most valuable applications of infrastructure intelligence.
Not simply identifying where investment is required.
Understanding whether investment has been successful.
A Model for the Future
The future of transport planning is unlikely to be defined by larger datasets alone.
It will be defined by better evidence.
The Stonnington deployment demonstrates how local government can transition from fragmented monitoring systems and point-in-time surveys towards continuous infrastructure intelligence.
What began as a replacement for a legacy counting system has evolved into a platform capable of supporting strategic decision-making across an entire municipality.
The network now provides visibility into movement, behaviour, risk and infrastructure performance at a scale that was previously difficult to achieve.
As transport networks become increasingly complex and community expectations continue to rise, the ability to continuously understand how a municipality is operating will become increasingly valuable.
In that regard, the City of Stonnington is not simply an example of technology deployment.
It is an example of how municipal infrastructure intelligence can be integrated into the everyday practice of transport planning, road safety and city management.
Conclusion
Seven Years of Evolution
The City of Stonnington deployment demonstrates how municipal monitoring infrastructure can evolve from a single-purpose counting system into a strategic evidence platform supporting an entire organisation.
The journey began in 2019 with a clear objective: replace a fragmented legacy monitoring network with a more scalable and capable solution.
The initial deployment established a reliable foundation for continuous visibility across the Chapel Street corridor. Over the following seven years, Council expanded that foundation to more than 40 roadside units and temporary deployments across the municipality.
In 2021, the network evolved beyond movement monitoring through the introduction of near-miss analytics and conflict assessment capabilities. This expanded the role of the infrastructure from measuring demand to understanding risk.
Between 2022 and 2025, the network expanded across the municipality to support active transport initiatives, cycling infrastructure planning, vulnerable road user assessment and broader public realm objectives. Permanent and temporary deployments enabled monitoring across a diverse range of operating environments, including strategic cycling corridors, shared paths, activity centres and constrained inner-urban streets.
Today, the network monitors more than 60 million vehicle movements each year while continuously assessing interactions between vehicles, pedestrians and cyclists. Approximately 157 near-miss events are analysed every day, providing an ongoing measure of safety exposure across the municipality.
Perhaps most importantly, the project has demonstrated the value of continuous observation as a foundation for evidence-based decision making.
The deployment has supported:
- Transport planning.
- Road safety initiatives.
- Active transport investment.
- Development assessment.
- Public realm improvements.
- Compliance and operational investigations.
- Infrastructure performance evaluation.
What began as a traffic monitoring project has become a long-term municipal asset.
Evolution of Capability
**2019: **Establish continuous monitoring across the Chapel Street corridor.
**2021: **Introduce near-miss analytics and conflict assessment.
2022–2025: Expand monitoring across cycling corridors and vulnerable road user networks.
**Today: **Operate a municipality-wide infrastructure intelligence platform supporting planning, safety and strategic decision-making.
Looking Forward
As transport networks become increasingly complex, the ability to continuously understand movement, behaviour and risk will become increasingly important.
The City of Stonnington deployment demonstrates how local government can move beyond isolated surveys and fragmented monitoring systems toward a more comprehensive evidence framework.
The result is not simply more data.
It is a deeper understanding of how infrastructure performs, how communities move and how investment decisions can be informed by continuous observation rather than isolated snapshots.
Seven years after the first deployment, the network continues to evolve.
Not as a collection of sensors.
But as a permanent layer of municipal intelligence supporting the future management of one of Australia's most dynamic urban environments.